# ecahrts渲染地图案例
# geojson获取方式
- 在线查询: http://datav.aliyun.com/tools/atlas/index.html (opens new window)
- 在线绘制: http://geojson.io/ (opens new window)
- 软件绘制: http://www.bigemap.com/ (opens new window)
# 效果
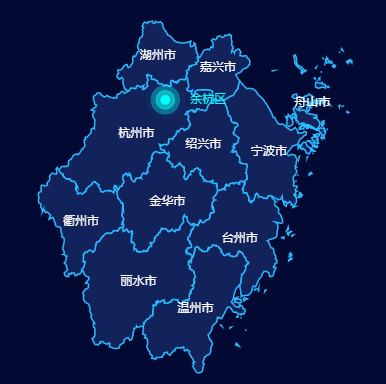
# 代码
<html>
<head>
  <meta charset="utf-8" />
  <title>浙江省-玉环市地图</title>
  <style>
  </style>
  <script src="https://cdn.jsdelivr.net/npm/jquery@1.12.4/dist/jquery.min.js" integrity="sha256-ZosEbRLbNQzLpnKIkEdrPv7lOy9C27hHQ+Xp8a4MxAQ=" crossorigin="anonymous"></script>
  <script src="https://cdn.jsdelivr.net/npm/echarts@4.9.0/dist/echarts.js"></script>
</head>
<body>
<div id='main' class='' style="width: 400px; height: 400px"></div>

<script>
  // geo网址
  // http://datav.aliyun.com/tools/atlas/index.html
  zjJson = '浙江省.json'


  $.get(zjJson, function(geoJson) {
    echarts.registerMap('zhejiang', geoJson);
    var chart = echarts.init(document.getElementById('main'));
    chart.setOption({
      backgroundColor: '#020933',
      tooltip: {

      },
      geo: [{
        map: 'zhejiang',
        aspectScale: 0.75, //长宽比
        zoom: 1.1,
        roam: false,
        itemStyle: {
          normal: {
            areaColor: '#013C62',
            shadowColor: '#182f68',
            // shadowOffsetX: 0,
            // shadowOffsetY: 25
          },
          emphasis: {
            areaColor: '#2AB8FF',
            borderWidth: 0,
            color: 'green',
            label: {
              show: false
            }
          }
        }
      }],
      series: [
        {
          type: 'map',
          map: 'zhejiang',
          label: {
            normal: {
              show: true,
              textStyle: {
                color: '#fff'
              }
            },
            emphasis: {
              textStyle: {
                color: '#fff'
              }
            }
          },

          itemStyle: {
            normal: {
              borderColor: '#2ab8ff',
              borderWidth: 1.5,
              areaColor: '#12235c'
            },
            emphasis: {
              areaColor: '#2AB8FF',
              borderWidth: 0,
              color: 'green'
            }
          },
          zoom: 1.1,
          roam: false
        },
        {
          type: 'effectScatter',
          coordinateSystem: 'geo',
          showEffectOn: 'render',
          rippleEffect: {
            period: 15,
            scale: 4,
            brushType: 'fill'
          },
          hoverAnimation: true,
          itemStyle: {
            normal: {
              color: 'aqua',
              shadowBlur: 10,
              shadowColor: '#333'
            }
          },
          label: {
            formatter: '{b}',
            position: 'right',
            offset: [15, 0],
            show: true
          },
          data: [
            {
              name: '余杭区',
              value: [119.978959,30.27365]
            }
          ]
        }
      ]
    });
  })
</script>
</body>
</html>
← v-if不加key的问题 vue项目总结 →